

Install & Start Grafana
For the installation of Grafana, please follow my Day 73,74 Blog "Grafana Installation."
Install Loki & Promtail using Docker
Before installing Loki & Promtail make sure you have docker installed in your instance.
  sudo apt-get update
  sudo apt-get install docker.io -y

  # Giving docker permission to current user
  sudo usermod -aG docker $USER
  sudo reboot

  # Verify Docker version
  docker --version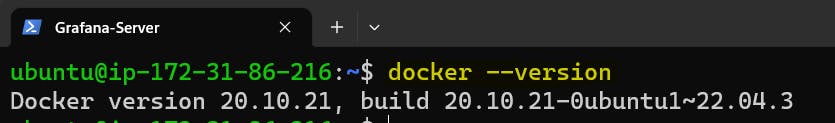
Download the Loki Config file into your current directory.
wget https://raw.githubusercontent.com/grafana/loki/v2.8.0/cmd/loki/loki-local-config.yaml -O loki-config.yaml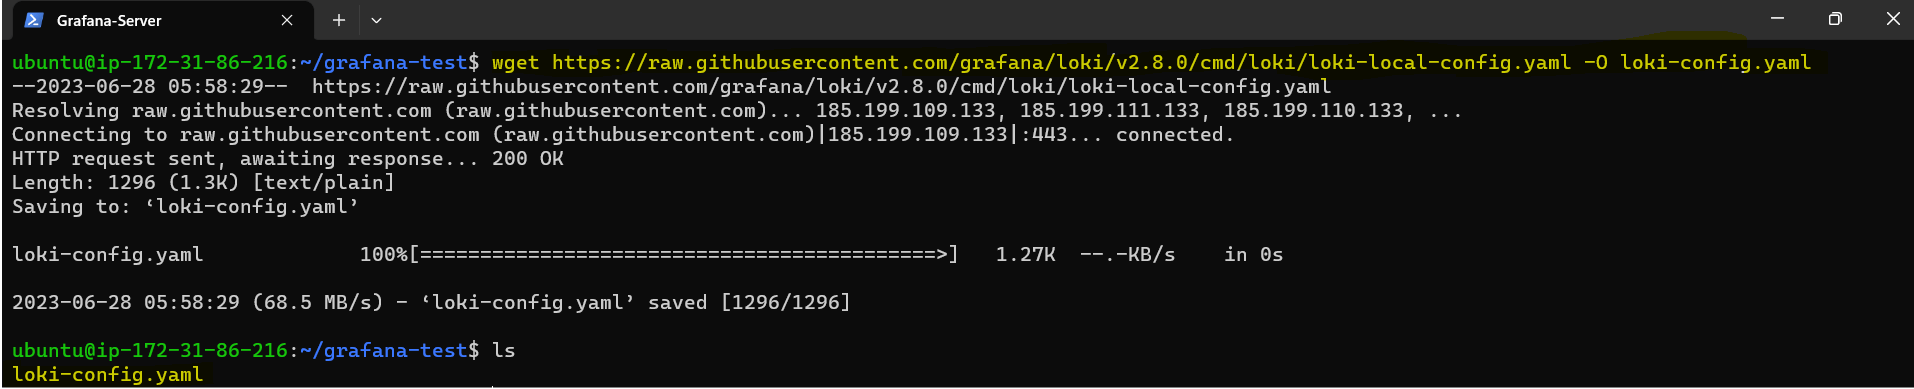
Run the Loki container using the following Docker command.
docker run -d --name loki -v $(pwd):/mnt/config -p 3100:3100 grafana/loki:2.8.0 --config.file=/mnt/config/loki-config.yaml
We can verify Loki is running using the docker container by using the following Docker command :
docker ps
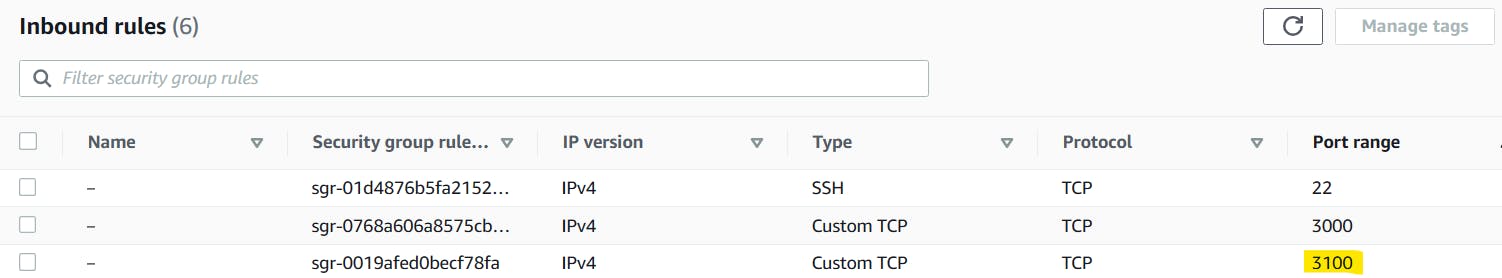
Now to access Loki, Go to the Security Group of your EC2 instance and add port 3100.
We can see Loki's metrics using the IPv4 address followed by port 3100 and metrics.
http://<public_ipV4>:3100/metrics
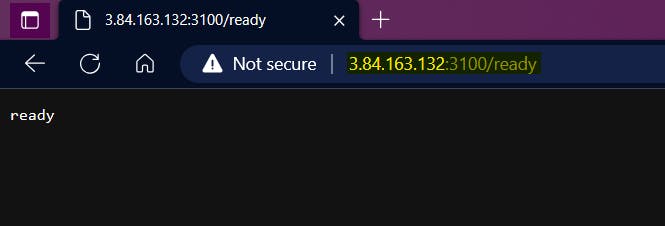
To verify whether Loki is ready or not, access the IPv4 address followed by port 3100 and ready.
http://public_ipV4:3100/ready
Now download the Promtail Config yaml file into your directory by using the following command:
wget https://raw.githubusercontent.com/grafana/loki/v2.8.0/clients/cmd/promtail/promtail-docker-config.yaml -O promtail-config.yaml
We can verify Promtail configuration file is there in the directory by using the following command:
  ls

  cat promtail-config.yaml
Now execute the Promtail container by using the following Docker command:
docker run -d --name promtail -v $(pwd):/mnt/config -v /var/log:/var/log --link loki grafana/promtail:2.8.0 --config.file=/mnt/config/promtail-config.yaml
We can verify both Loki and Promtail are running using
docker pscommand.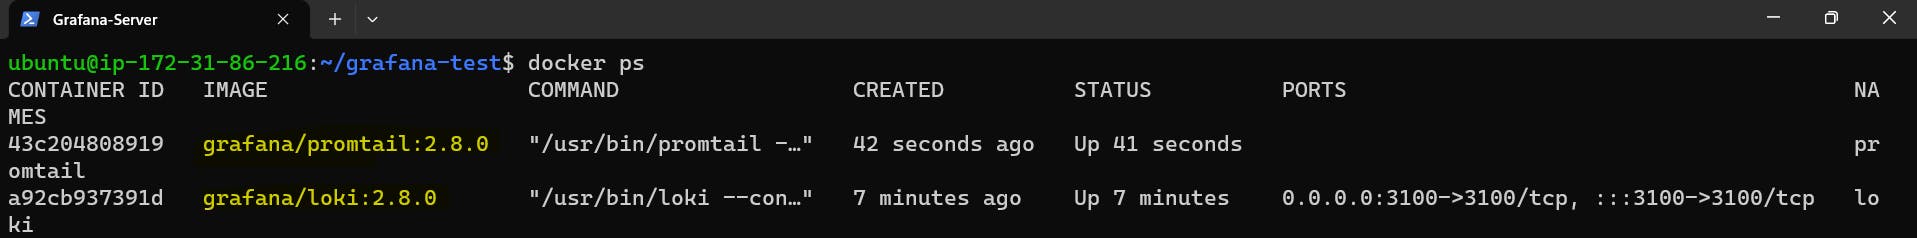
Configure Loki as a Data Source
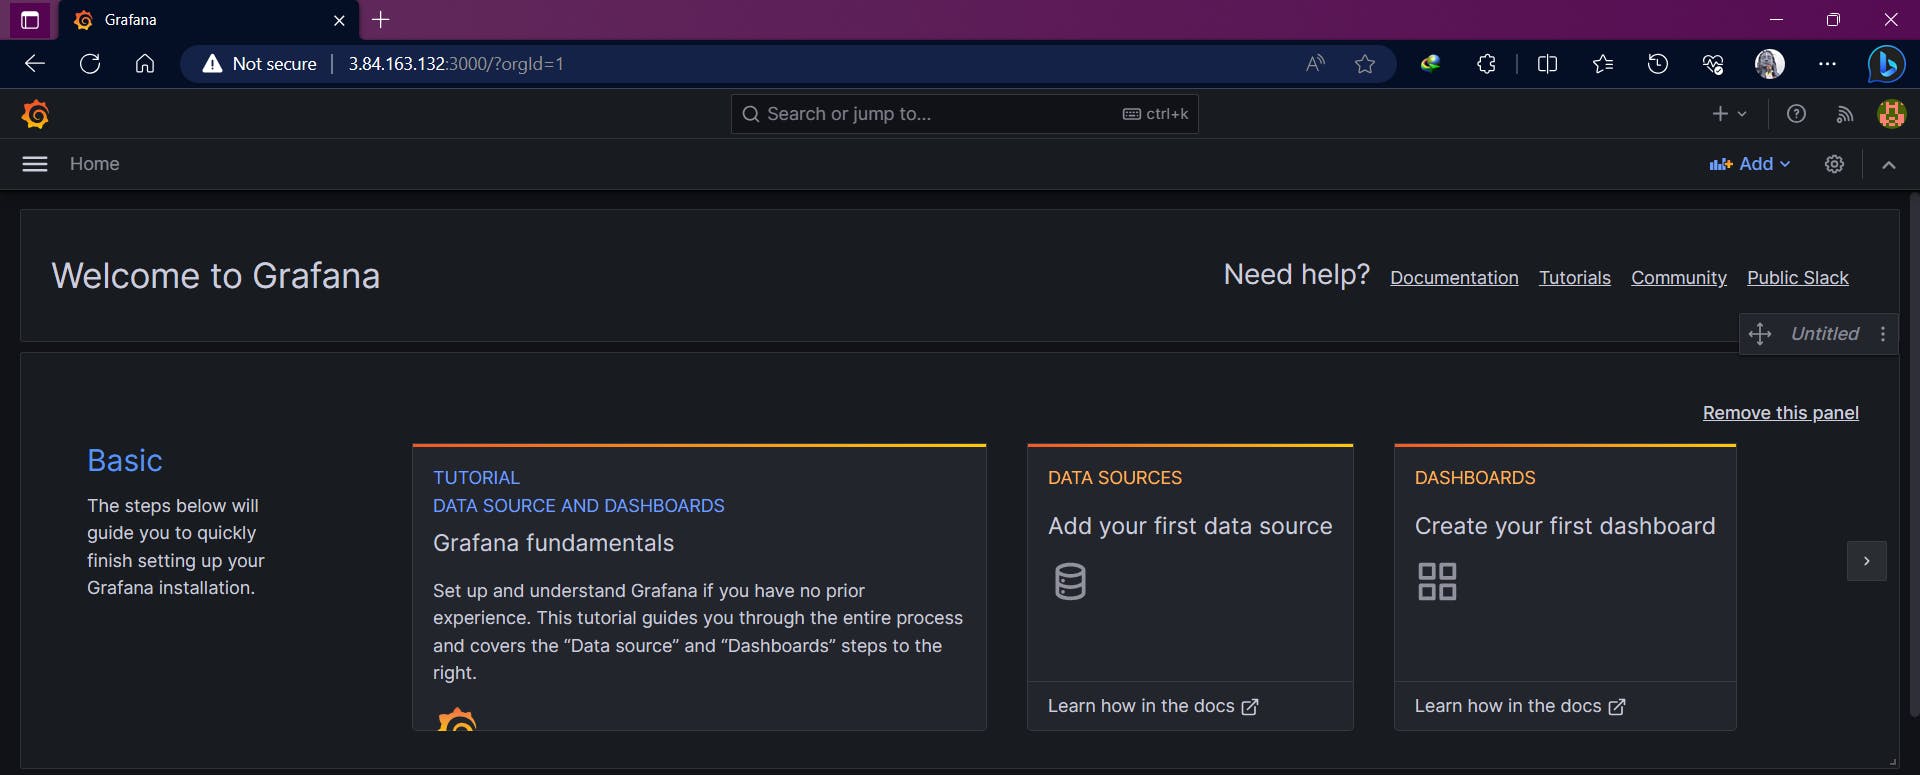
Once both Loki and Promtail are configured in the instance, Login to the Grafana Home Page
In the navigation drawer either there is DataSource click on it or you can get it by clicking on the left hamburger menu, hovering over there is a gear icon (second last one) and clicking on "Data Sources".
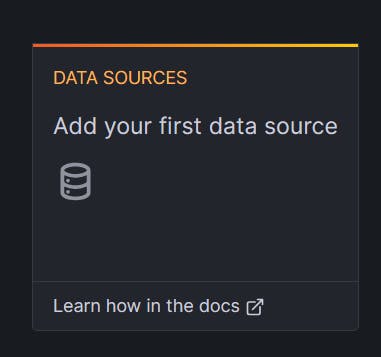
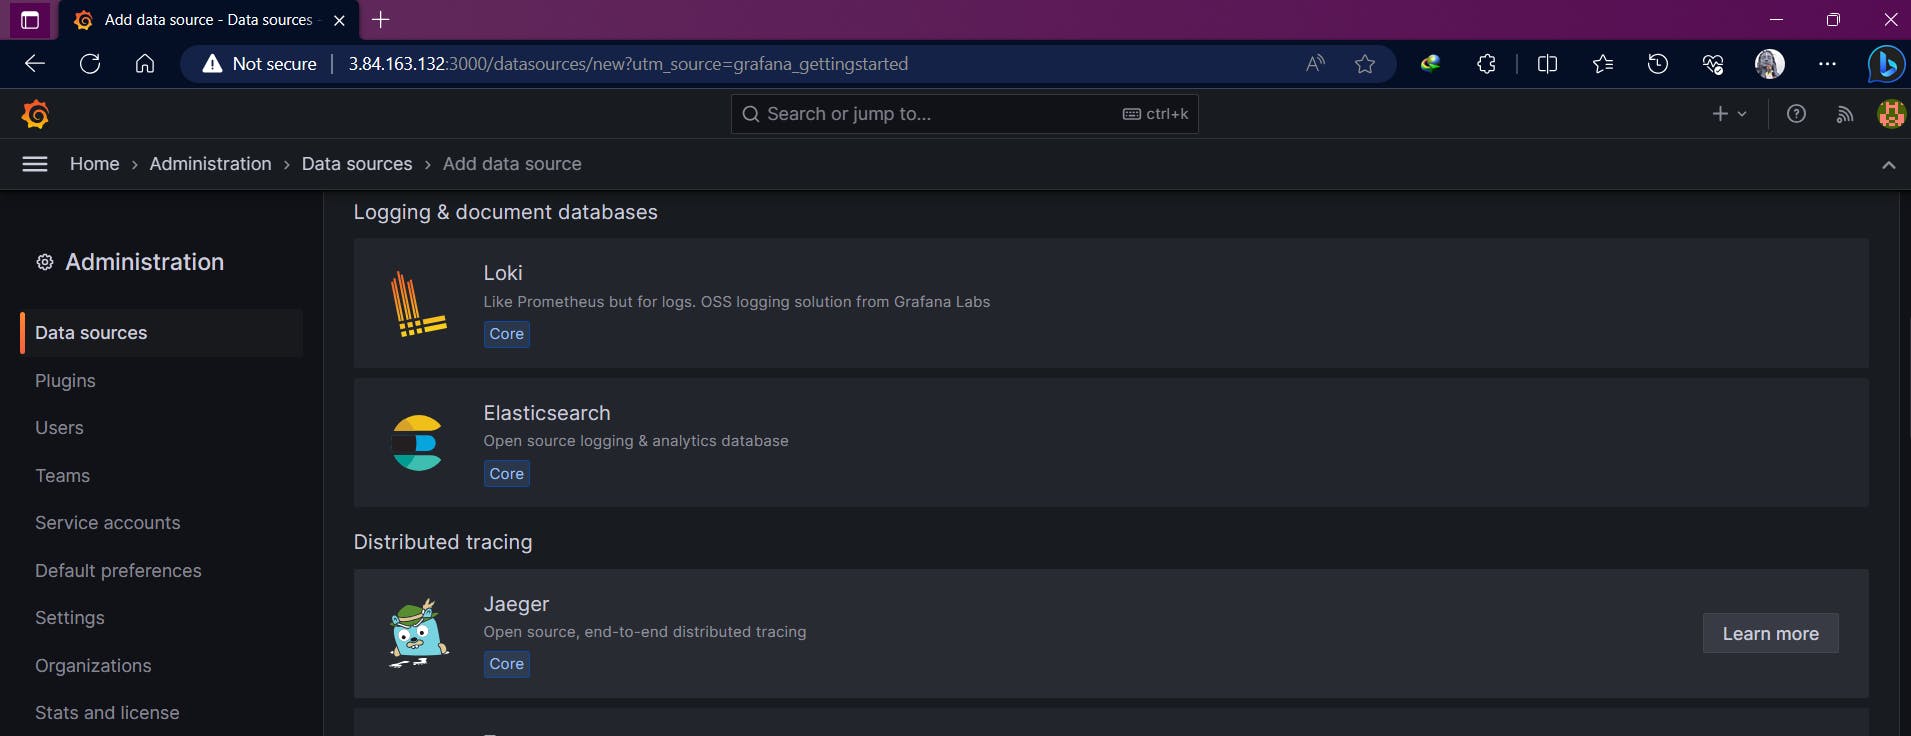
Click on "Add data source" and search for "Loki". Click on it.
As the Loki prompt is opened fill in the details like Name and in the HTTP provide the URL i.e, http://127.0.0.1:3100
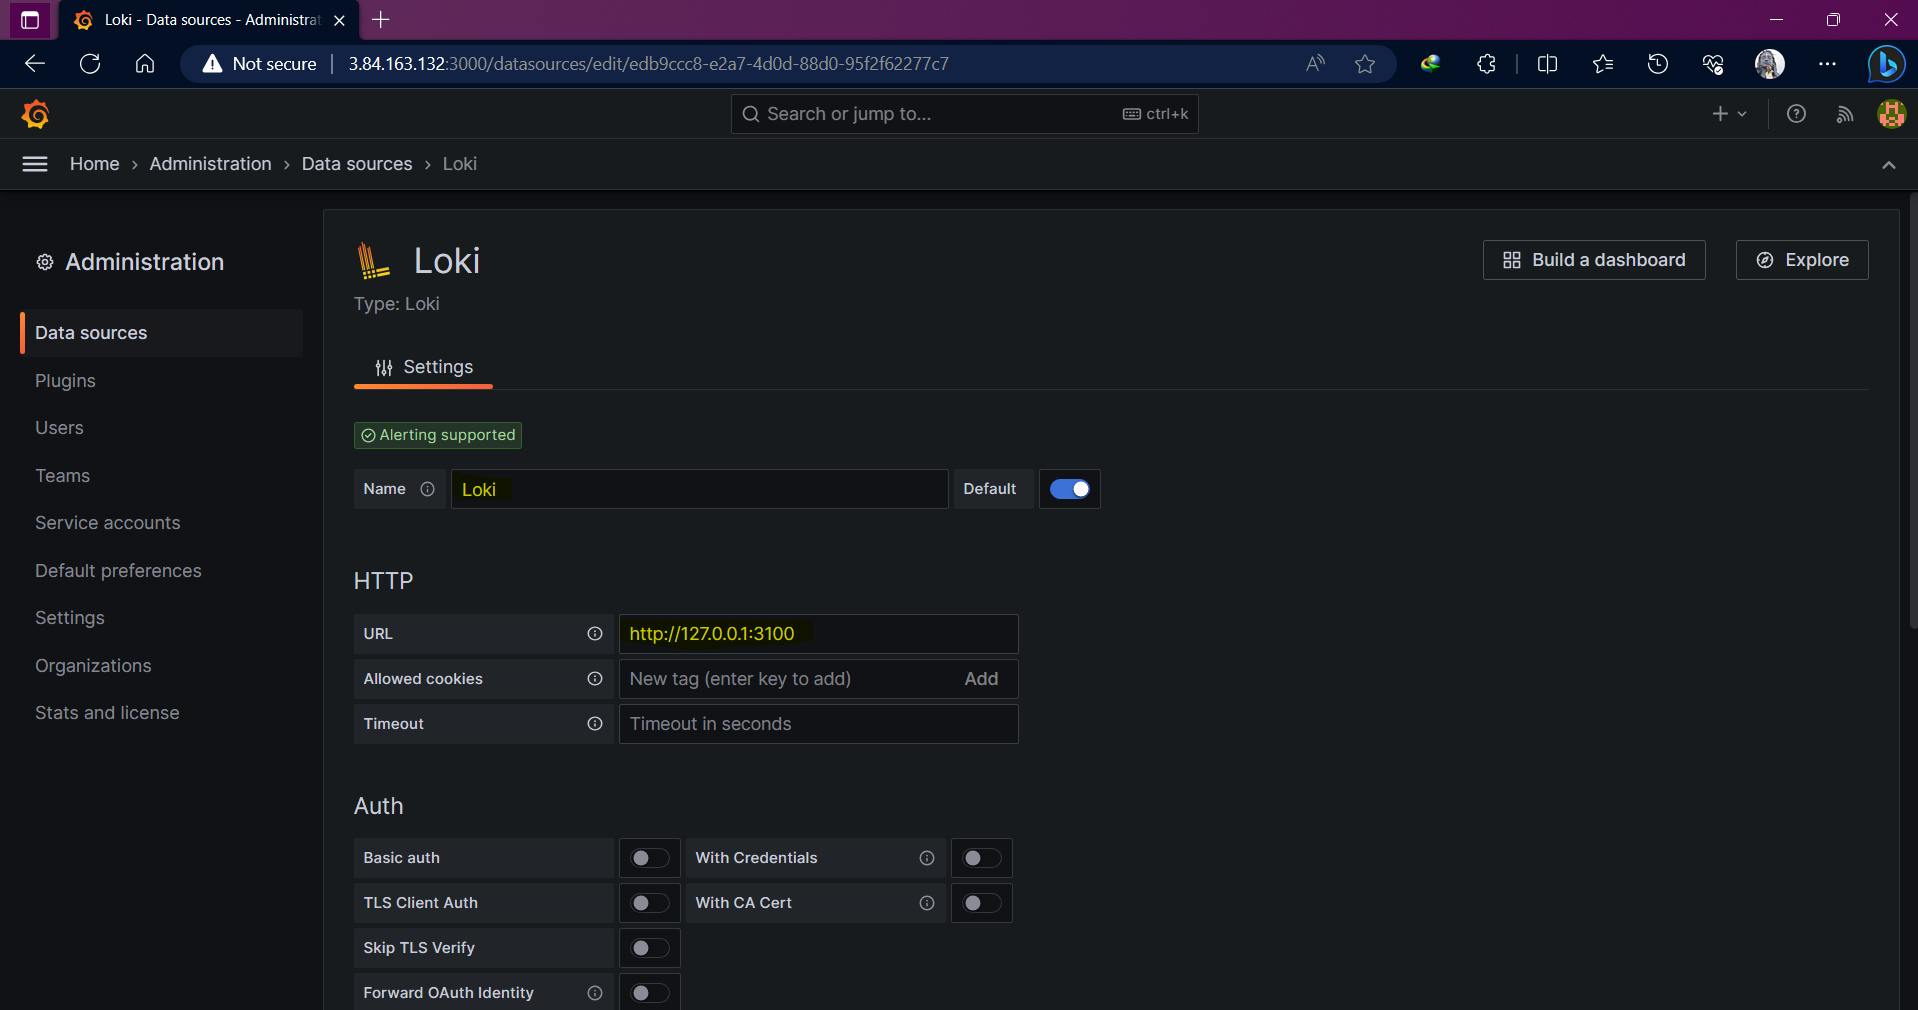
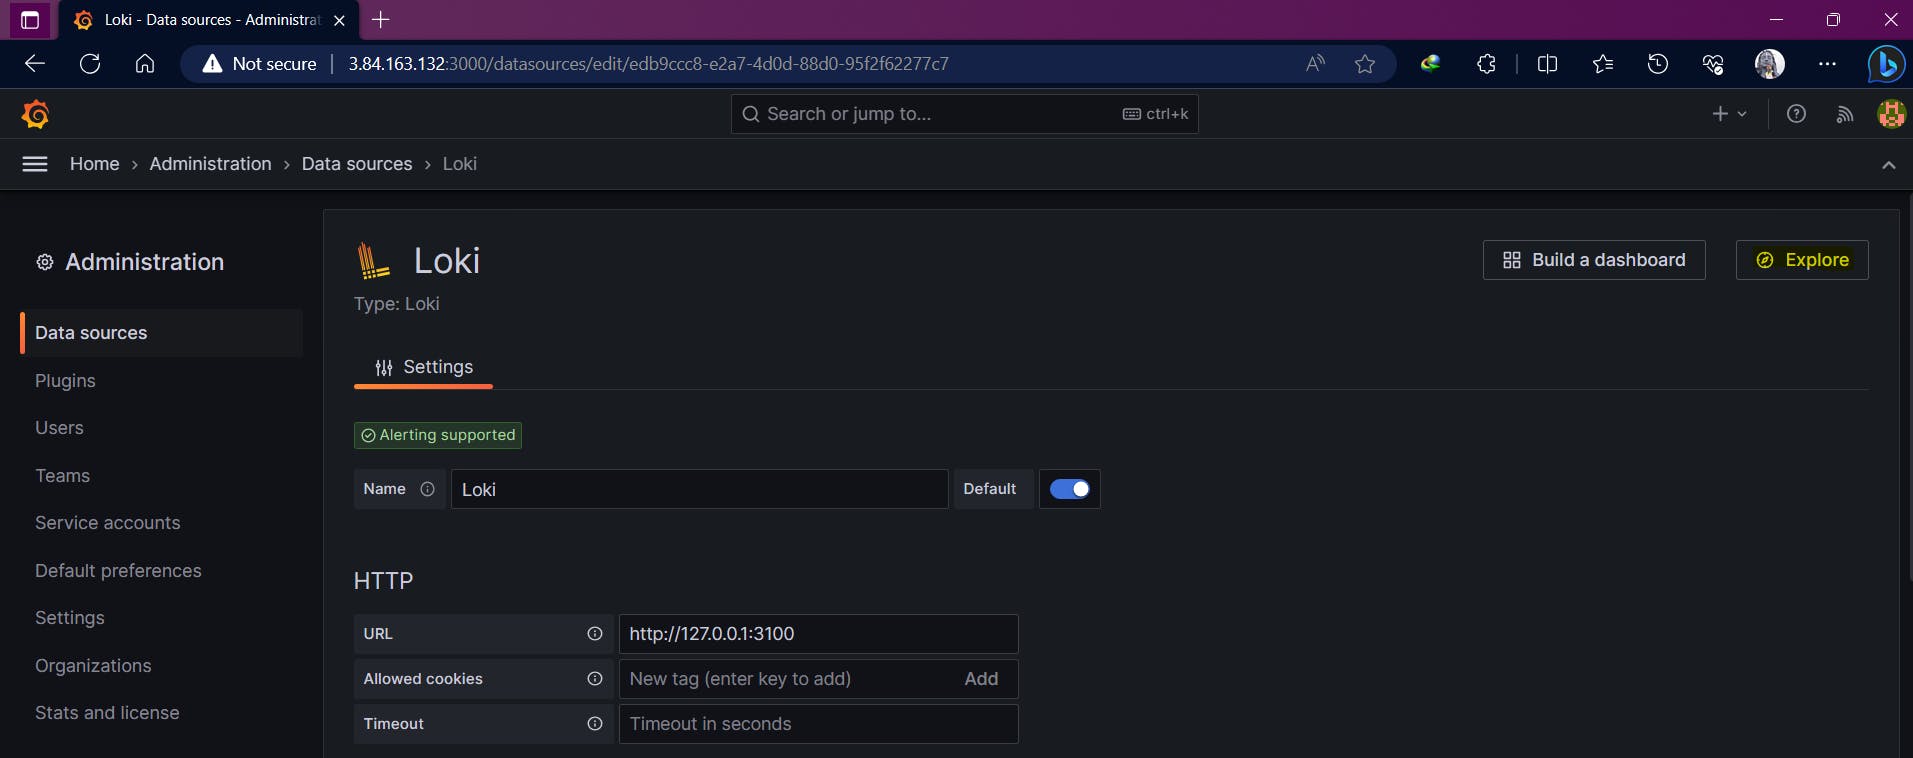
Click on "Save and Test". You will get a prompt saying "Data Source Successfully Connted" so you can conclude that your connection to Grafana using Loki and Promtail is successful.
Now click on Explore to create metrics.
We will create metrics that will show logs containing Docker in it.
  Name -> System Generated Logs
  Label Filters -> jobs, varlogs
  Line Contains -> docker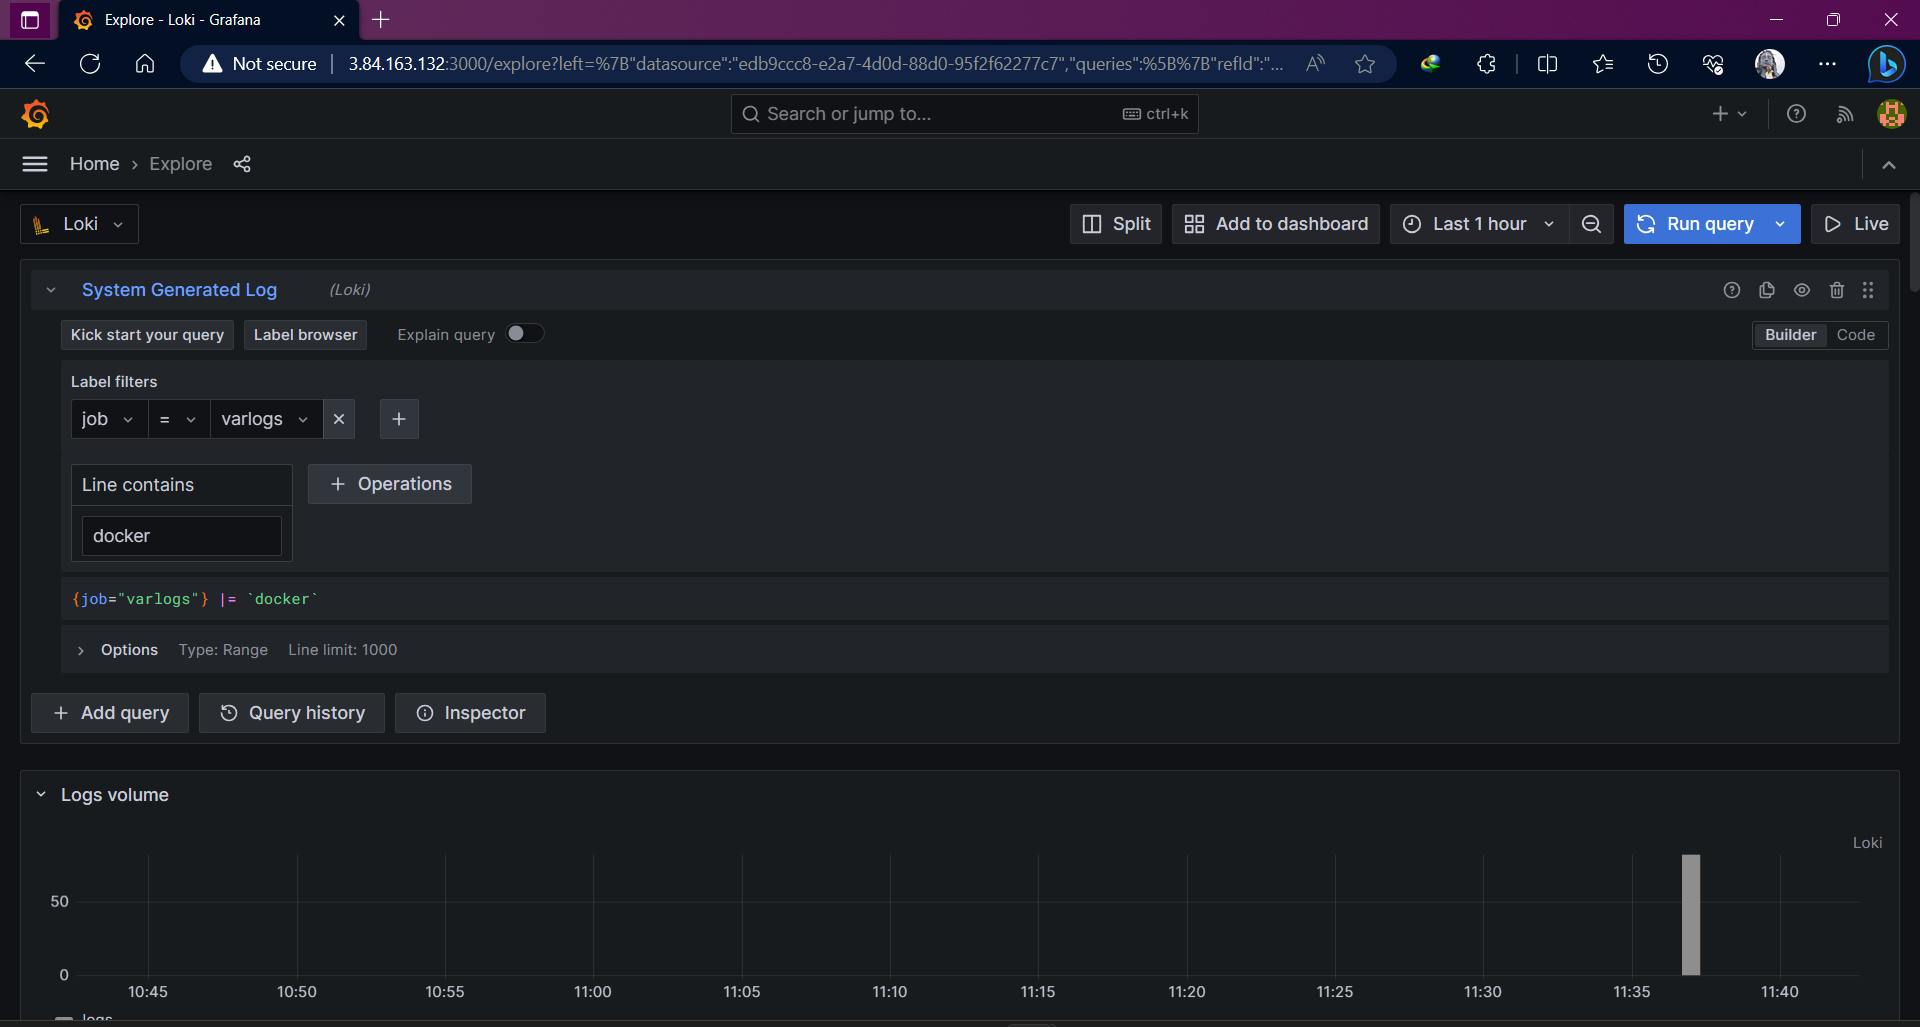
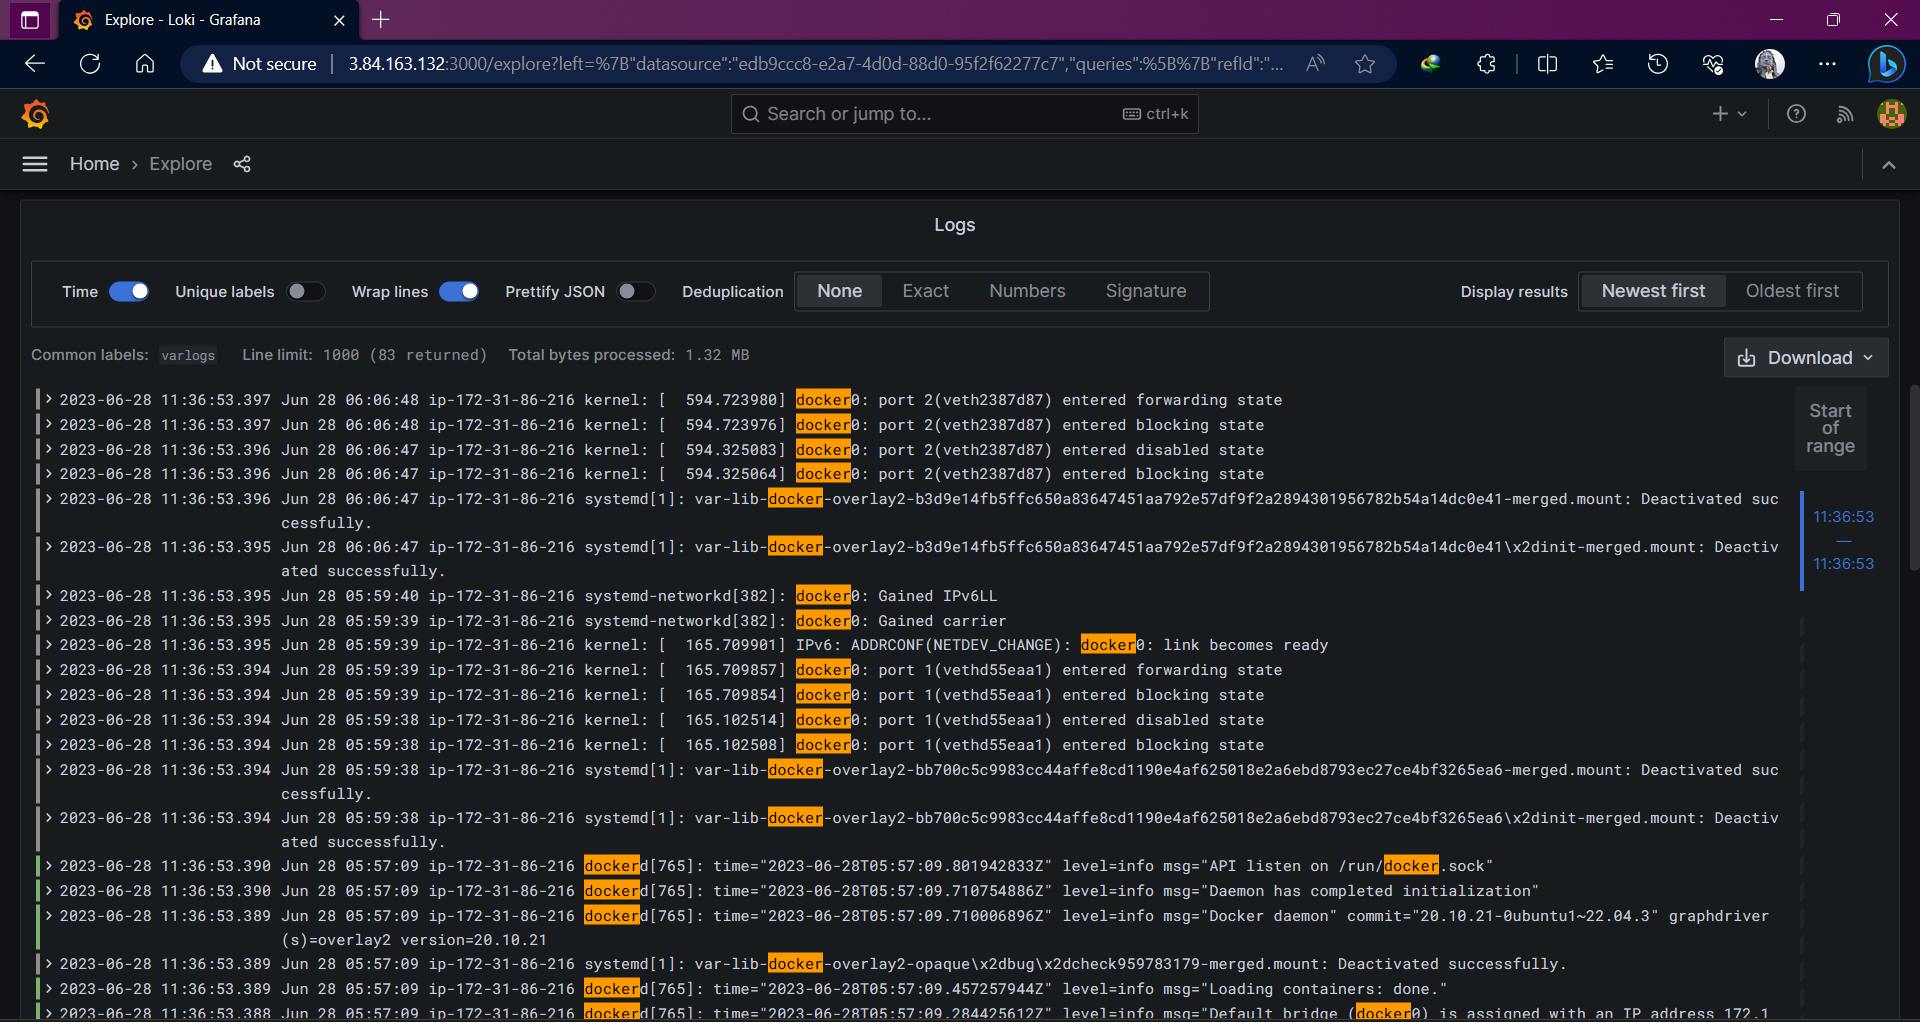
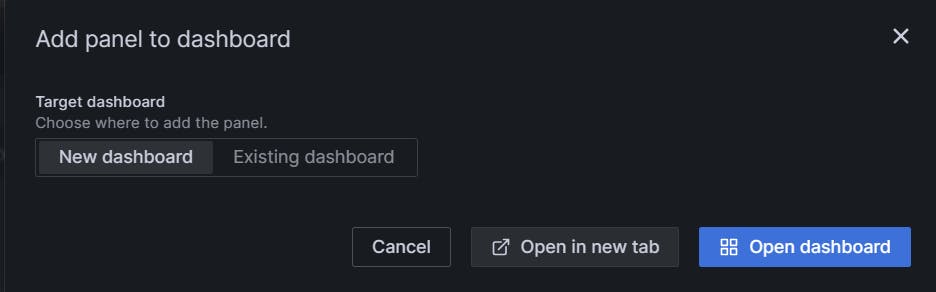
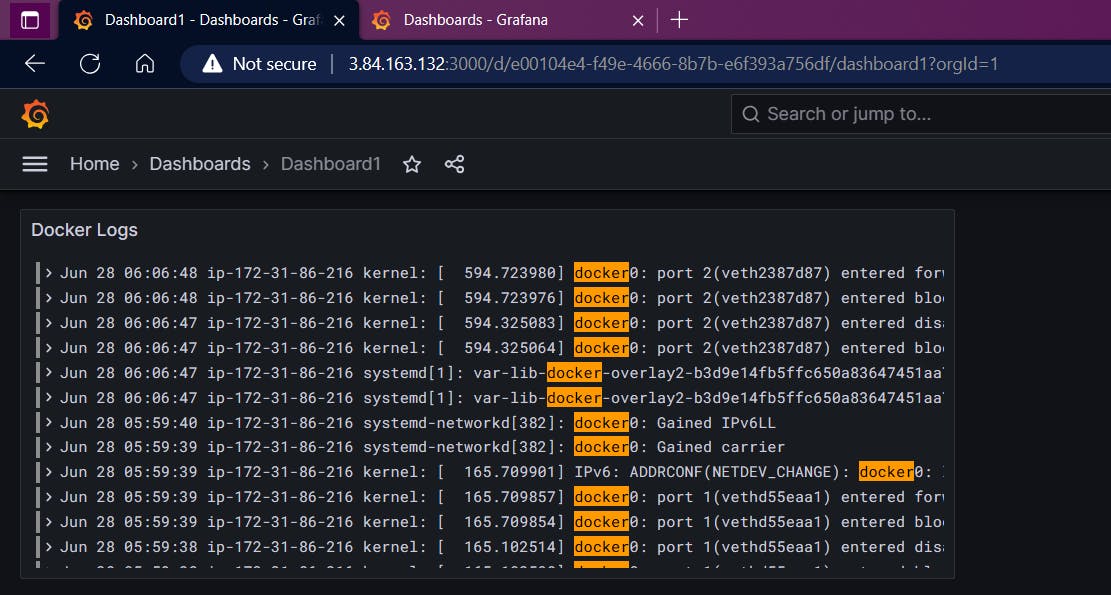
Once you get the output we can put the result into a new dashboard, before that named it.
Thank You,
I want to express my deepest gratitude to each and every one of you who has taken the time to read, engage, and support my journey.
Feel free to reach out to me if any corrections or add-ons are required on blogs. Your feedback is always welcome & appreciated.
~ Abhisek Moharana 🙂