Grafana Alerting
Day 77 of 90daysofdevops

I have been working as a Performance Engineer as well as Dynatrace Developer in TCS for 1 Year. I had interest in APM Tools, LoadRunner, AWS, Docker, Java, Python.
Define Grafana Alerting
Grafana alerting is a feature that allows users to set up and manage alerts based on specific conditions or thresholds within their data. With alerting in Grafana, users can define rules to monitor metrics, query results, or other data sources and receive notifications when certain conditions are met.
Grafana Alerting is available for Grafana OSS, Grafana Enterprise, or Grafana Cloud. With Mimir and Loki alert rules you can run alert expressions closer to your data and at a massive scale, all managed by the Grafana UI you are already familiar with.
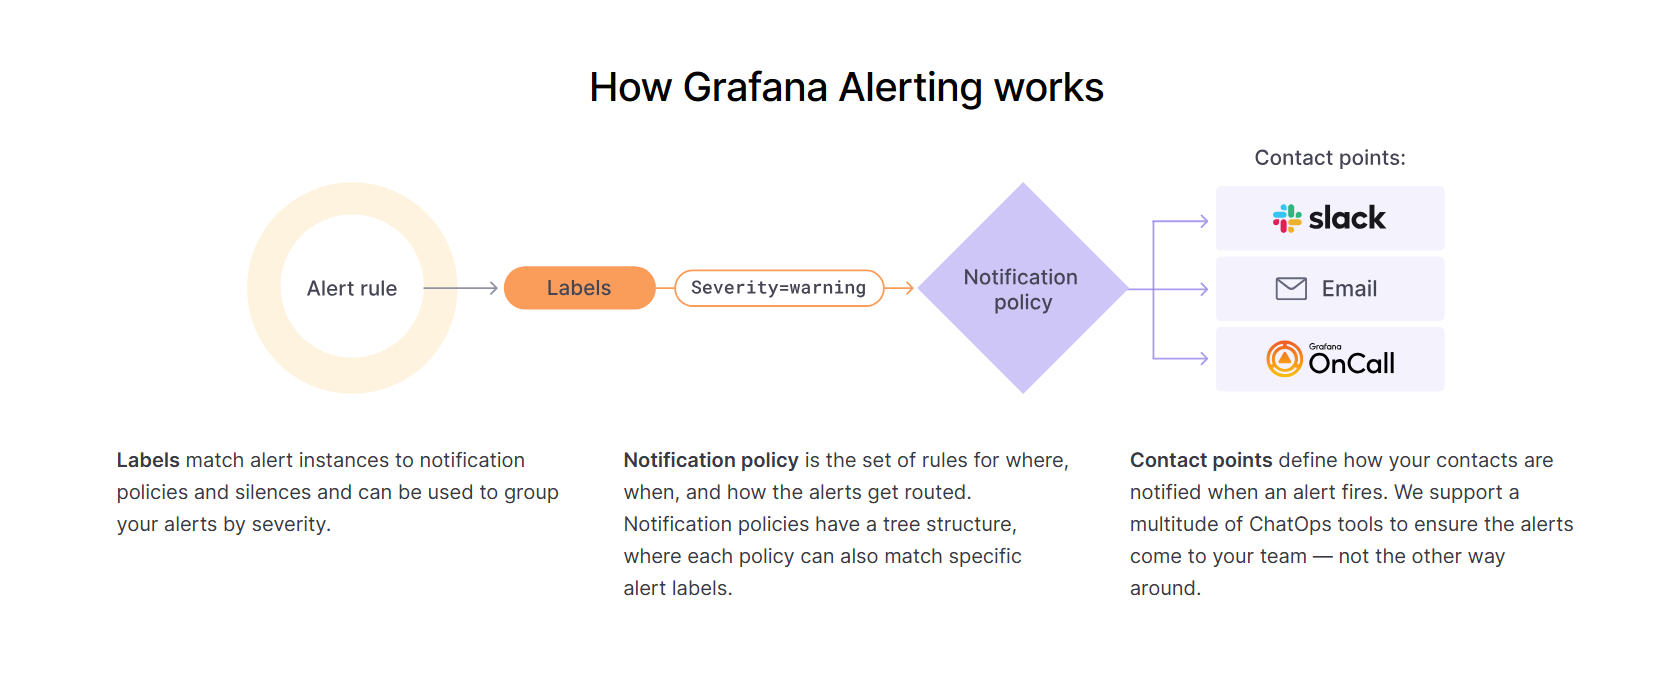
Key features of Grafana Alerting
Alert Rules: Users define rules or conditions that trigger an alert when met. These rules can be based on thresholds, comparisons, or aggregations of data.
Multiple Alert States: Alerts can have different states, including OK, Pending, and Alerting. This allows for tracking and acknowledgment of alerts.
Alert Annotations: Grafana can automatically add annotations to a dashboard when an alert is triggered. These annotations provide context for the alert event and help with debugging or investigation.
Alert Dashboards: Grafana allows the creation of dedicated dashboards to visualize and monitor the status of alerts and their history.
Alert Notifications History: Grafana keeps a history of triggered alerts, including their state changes and notifications sent, enabling users to review past alert events.
Silencing and Muting: Users can silence or mute alerts for a specified period to prevent repeated notifications during planned maintenance or known issues.
Set up Grafana Alerting
To create a Grafana-managed alert rule, complete the following steps.
1️⃣ In the left-side menu, click Alerting.

2️⃣ Click Alert rules.

3️⃣ Click on Create alert rule. The new alert rule page opens where the Grafana managed alerts option is selected by default.

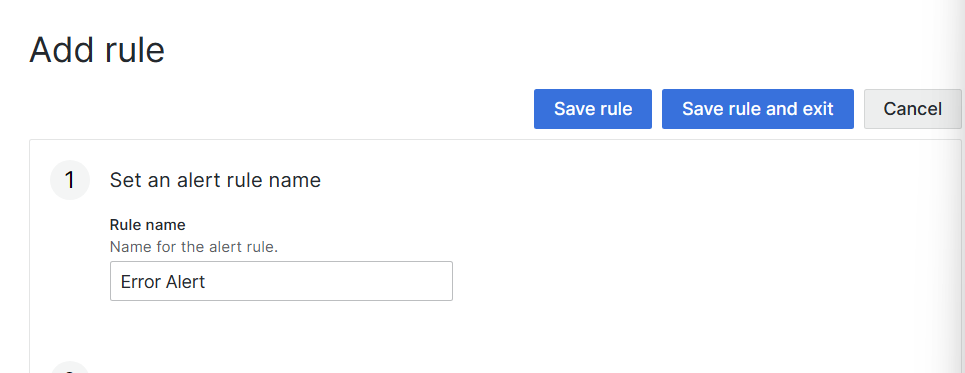
4️⃣ Add the rule name. The recording name must be a Prometheus metric name and contain no whitespace.
In Rule name, add a descriptive name.

5️⃣ select Mimir or Loki recording rule option.
Select your Loki or Prometheus data source.

6️⃣ add alert evaluation behavior.
Enter a valid For the duration. The expression has to be true for this long for the alert to be fired.

7️⃣ Now save the rule
8️⃣ Preview

9️⃣ Click Save to save the rule or Save and exit to save the rule and go back to the Alerting page.

Thank You,
I want to express my deepest gratitude to each and every one of you who has taken the time to read, engage, and support my journey.
Feel free to reach out to me if any corrections or add-ons are required on blogs. Your feedback is always welcome & appreciated.
~ Abhisek Moharana 🙂


