Build a Grafana Dashboard
Day 76 of 90daysofdevops

I have been working as a Performance Engineer as well as Dynatrace Developer in TCS for 1 Year. I had interest in APM Tools, LoadRunner, AWS, Docker, Java, Python.
Why do we need Dashboard?
Data Visualization: Dashboards present complex data sets visually, aiding comprehension and analysis.
Real-Time Monitoring: Dashboards provide up-to-date insights by connecting to live data sources, enabling proactive decision-making.
Centralized Information: They consolidate data from multiple sources into a single location, allowing easy access and monitoring of key metrics and KPIs.
Data Exploration: Dashboards offer interactive features for exploring and drilling down into data, revealing patterns and correlations.
Performance Tracking: They track performance against targets, benchmarks, or historical data, highlighting areas of success or improvement.
Communication and Collaboration: Dashboards facilitate sharing and discussion of data-driven insights, fostering collaboration and alignment.
Decision-Making and Actionability: Dashboards empower users to make informed decisions and take timely actions based on actionable insights derived from the data.
Benefits of Grafana Dashboard
Visual Variety: Grafana provides a wide range of visualization options, allowing users to choose the most suitable type for their data.
Customization: Users can extensively customize their dashboards, adjusting colors, sizes, and labels to create personalized and branded visuals.
Interactivity: Grafana dashboards are highly interactive, enabling users to drill down, zoom in/out, and apply filters for detailed exploration.
Real-Time Updates: Dashboards can update in real time, providing immediate insights into changing data streams and time-sensitive metrics.
Templating and Variables: Users can use templates and variables for dynamic filtering and switching of data based on user-defined criteria.
Alerting and Notifications: Robust alerting capabilities help users set up thresholds and triggers, sending notifications for timely awareness of critical events.
Plugin Ecosystem: Grafana has a thriving community and plugin ecosystem, offering additional data sources, visualizations, and functionalities for enhanced dashboards.
Dashboard Creation
Log in to Grafana and navigate to the dashboard section.
Click on "New Dashboard" to create a blank dashboard.
Add panels to your dashboard by clicking on "Add Panel" and selecting the desired visualization type.
Configure each panel by selecting the data source, defining queries, and customizing the visualization options.
Arrange the panels on the dashboard canvas to create the desired layout.
Customize the dashboard by adding titles, annotations, and variables.
Save the dashboard and give it a meaningful name.
Monitor Error Count
Create a new Dashboard, now click on Add -> Visualization ->New Metrics add

In the Query editor below the graph, enter the details of the label and add a suitable title for the Panel.
  Labesl Filter ~> Job = varlogs
  line contains ~> error
  Rate ~> Count over time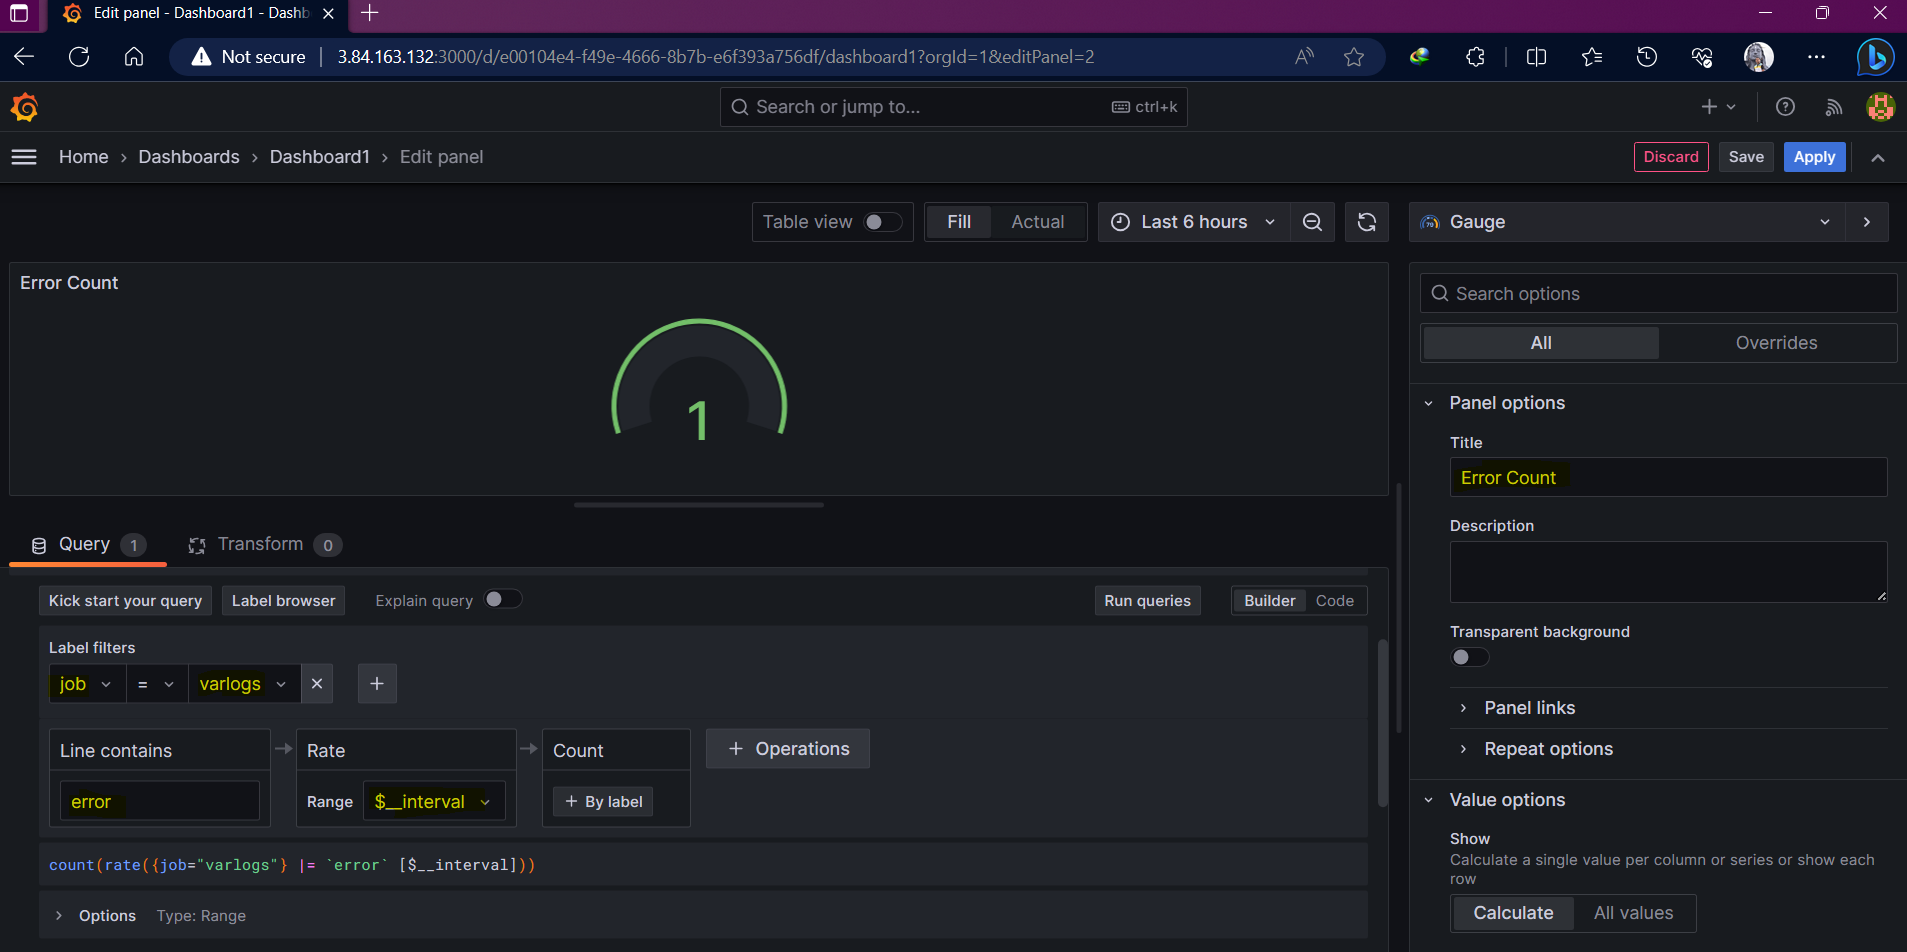
As all the details are filled in, click on "Run Queries" and then add the panel to the dashboard.

Monitor Docker Logs
For creating a panel for the Docker log, in the Query editor below the graph, enter the details of the label and add a suitable title for the Panel.
  Labesl Filter ~> Job = varlogs
  line contains ~> docker
As all the details are filled in, click on "Run Queries" and then add the panel to the dashboard.
Monitor Grafana Logs
To monitor the Grafana log so we have to add the Grafana directory path in the promtail configuration file.
In the promtail-config.yaml add the Grafana job and log file location.
  - job_name: grafanalogs
    static_configs:
    - targets:
        - localhost
      labels:
        job: grafanalogs
        __path__: /var/log/grafana/*log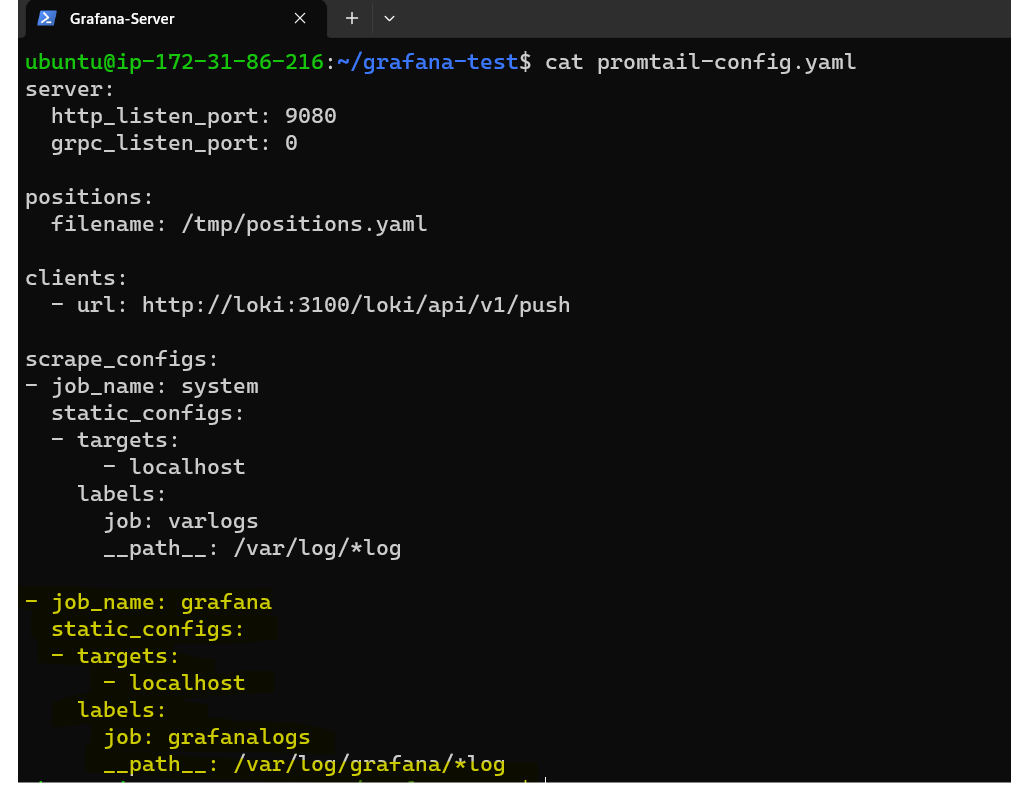
Now restart the promtail container using the following Docker Command.
  docker ps

  docker restart <container_ID>
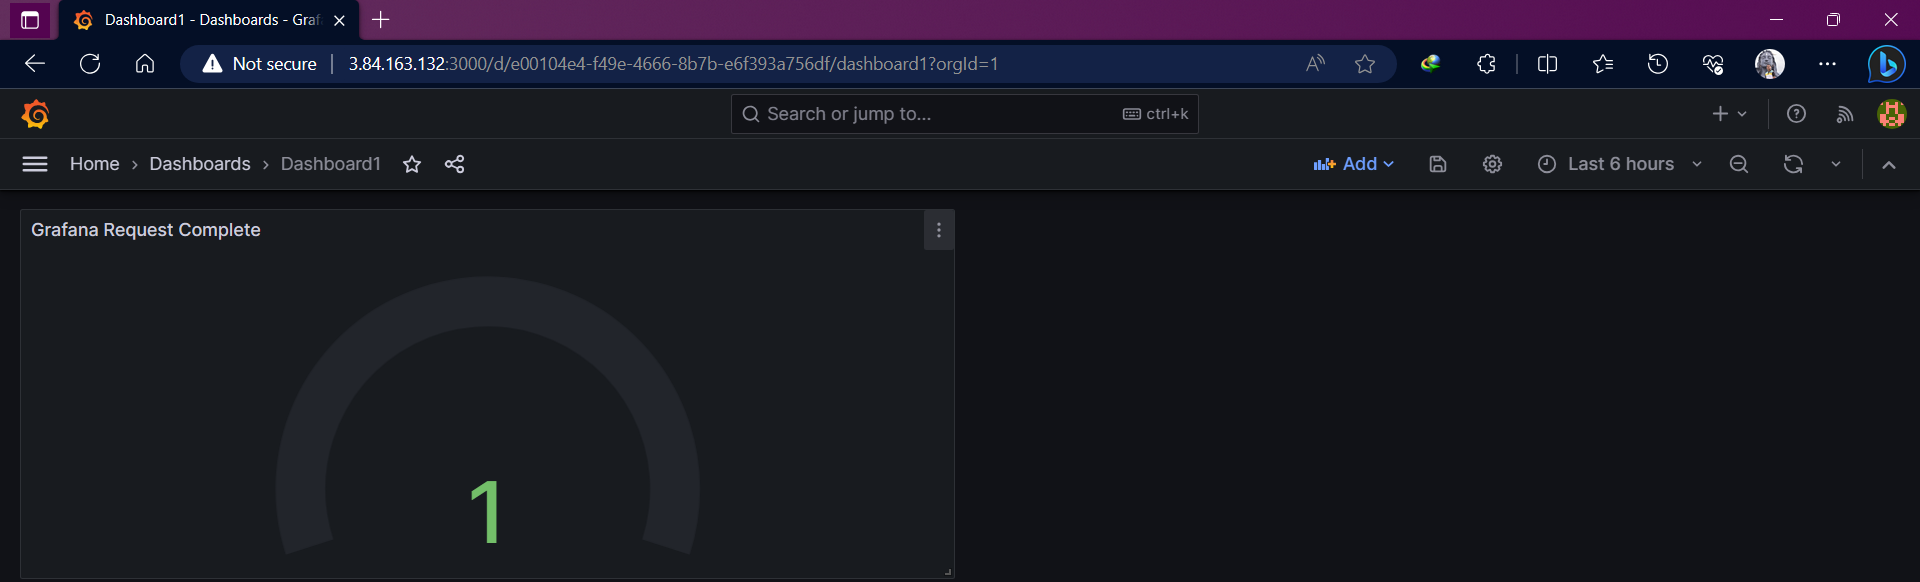
Now add the items in the Query for getting Grafana Logs enter the details of the label and add a suitable title for the Panel.
  Labesl Filter ~> Job = grafanalogs
  line contains ~> Request Completed
  Rate ~> Count over time

  # For getting Grafana error count chnage the line contains to "errors"
As all the details are filled in, click on "Run Queries" and then add the panel to the dashboard.
Monitor Nginx Logs
To monitor the Nginx log so we have to add the Nginx directory path in the promtail configuration file.
In the promtail-config.yaml add the Nginx job and log file location.
  - job_name: nginx
    static_configs:
    - targets:
        - localhost
      labels:
        job: nginxlogs
        __path__: /var/log/nginx/*log
Now restart the Promtail container using the following Docker command:
  docker ps

  docker restart <container_ID>
Now add the items in the Query for getting Nginx Logs enter the details of the label and add a suitable title for the Panel.
  Labesl Filter ~> Job = nginxlogs
  line contains ~> 404
  Rate ~> Count over time
As all the details are filled in, click on "Run Queries" and then add the panel to the dashboard.
There is no error from the Nginx server so "No Data" is showing up. Once there is a log containing a "404" error the count will be shown here in the Dashboard.

Thank You,
I want to express my deepest gratitude to each and every one of you who has taken the time to read, engage, and support my journey.
Feel free to reach out to me if any corrections or add-ons are required on blogs. Your feedback is always welcome & appreciated.
~ Abhisek Moharana 🙂


